
SIPO’s six month report on patent filings, available on line in China shows some surprising data for the first six months of 2014.
Regionally, Jiangsu and Beijing are in the number 1 and 2 slots in terms of patent applications. Both regions showed continued growth (slide 3). Guangdong, however, showed a slight decline. Anhui, Guangxi and Guizhou showed the most increase in patent applications in percentage terms (70-90%). Interestingly, while invention patent applications increased by about 4% from domestic applicants, foreign applications were down about 11% (slide 9). In general, increases in Chinese-origin invention patents applications in China were not offset by decreases in utility model and design patents, with an overall decrease of 8 percent for Chinese versus a 2% overall increase for foreigners.
In terms of patent grants, amongst foreign countries, the United States showed an increase of 12% from the same period last year, while Japan and Germany (number 1 and 3, respectively amongst foreign filers), both showed declines of about 4.5%, as reflected in the following chart:
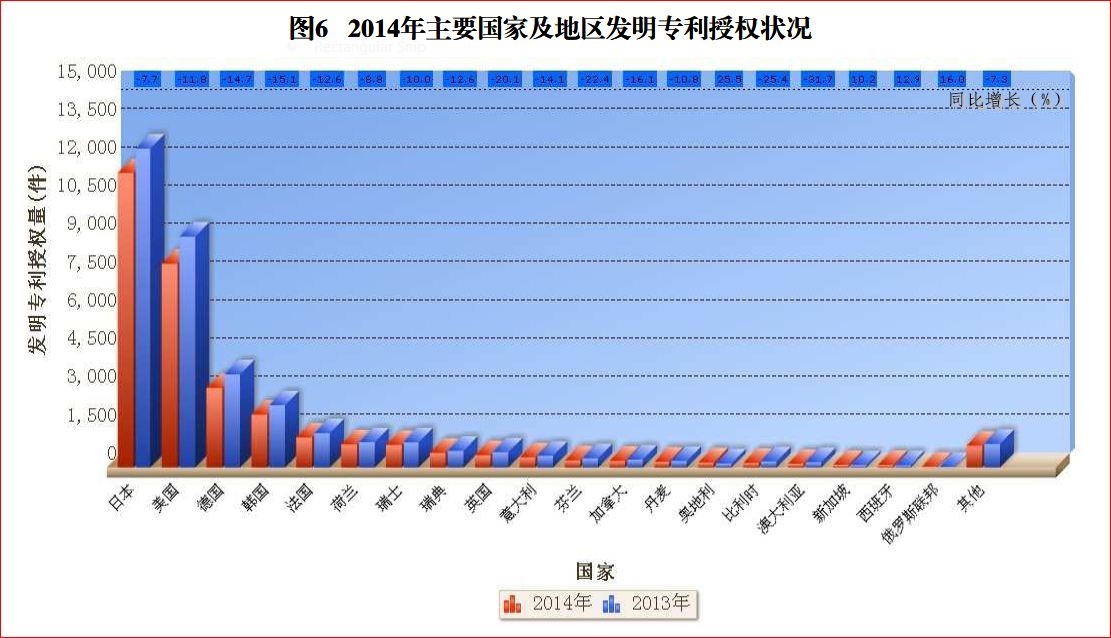
In this chart, the orange and blue bars represent 2014 and 2013 respectively. Japan, the USA , Germany, Korea and France are the first countries listed to the far left on the x axis. The y axis reveals the number of granted invention patents in 2014. The chart shows that patent grants were down for all three top foreign applicants for the first half of 2014 (by the percentages at the top of this graph). However, this could be due to drops in applications from several years prior.
The problem of low maintenance rates for Chinese-source patent applications also remains acute. As I have previously blogged, China already shows lower patent maintenance rates than other IP-5 jurisdictions. This report makes it clear that Chinese filers appear to be the predominant parties in China who prematurely curtail patent protection (p. 15).
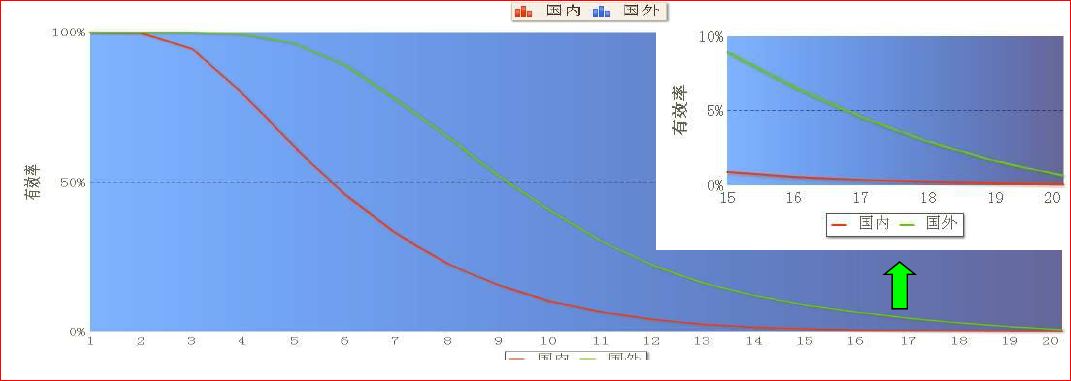
The green line represents domestic patent filers; the orange line is foreign patent filers. The x axis shows the year of the patent, through its 20th year, while the y axis shows percentage of patents filed. The close-up image in the upper right corner is of SIPO’s own preparation.
The report also identifies Beijing as the city with the highest density of patents per capita (nearly 5,000 per million people). Shanghai and Tianjin follow. This further underscores that innovation is an urban phenomenon (page 17). Guangdong also remained the main filer of PCT applications with nearly 6,000 applications — outpacing second place Beijing with about four times the number of applications (p. 25).
Some of the more dramatic changes are in utility model patents and design patents. UMP applications from China dropped by 7.5% and design applications dropped by 28%. The most dramatic drops were in non-service applications for UMP’s and in service inventions for designs (24.5% and 34.9% respectively). However, foreign applications for UMP’s and designs continue to grow from a modest base (p. 29). Non-service inventions still play a large role in China’s domestic utility model and design patent application portfolios (about 26.4% and 50.7% respectively).
In summary, the data shows continuing dramatic changes in China’s patent system, including shifting trends amongst domestic and foreign filers. My guess is that the report shows the impact of an increased focus on invention patents by the government, and a decline in subsidies for utility model and design patents in key patenting regions. The increase in service inventions for UMP’s is significant as it may show a shift to patenting in UMP’s for enterprises that actually practice the invention. The rapid increase in regions like Anhui may be due to active government support in those regions. The drops in patent filings for foreigners are surprising considering China’s continuing economic growth. The report also underscores a predictable rise in China’s cities as centers of patenting activity. Although individual PCT filers are not identified, the growth in PCT filings is probably to continued growth of companies like Huawei and ZTE from Guangdong.
Categories: Patent, Patent Maintenance, Patent Quality, Patents, Service Invention, SIPO, Statistics, Utility Model, Validity


Great insights!
LikeLike
Well the article was informative. It would be great if you could provide the full english version of the charts for further reproduction and analysis of the information
LikeLike